Buoyant Economies
Money and Unsustainable Debt
There has been some concern, particularly in the USA, about the unsustainable levels of domestic and foreign debt that have been accumulating. On 14 June 2010, the Governor of the Reserve Bank of New Zealand has stated:
Our net external liabilities cannot keep increasing with impunity. Ultimately . . . . the sheer size of servicing our obligations will become an intolerable burden to the country. (New Zealand’s Economic Recovery, External Vulnerabilities and the Balancing Act Ahead)
This page considers how domestic debt from bank credit has become unsustainable. It looks at the theory and then presents some charts showing the growth of debt from bank credit is unsustainable in Australia and the USA.
Equation (12) from the page on Money and Inflation concludes with the following definition of money:
(Pt/P0) = Ö((Lt/L0)/(Yt/Y0)) (1) If you see an "H" in this equation, it should be a square root sign.
Where Pt are average prices at time "t";
Lt is the money supply (the total amount of money in the economy) at time "t"; and
Ytis the quantity of goods and services produced in time "t".
The problem revealed in this equation is that if there is any inflation, the money supply must grow faster than income. That is, from equation (1):
Lt/L0 = (Yt/Y0)(Pt/P0)2 (2)
Countries with floating exchange rates have only one source of additional money: that is, bank credit. Every dollar of additional bank money created required a borrower simultaneously to take up an an additional dollar of debt. Also, every additional dollar created causes spending to exceed income, creating a current account deficit and foreign debt. (See the impact of the floating exchange rate system on debt.) That is:
dLt = dCrt = dBdt = dBft (3)
Where dCrt is the amount of bank credit created in time "t";
dBdt is the amount of domestic bank debt created in time "t";
dBft is the amount of foreign debt created in time "t" where foreign debt includes the reduction in domestic equity or the increase in foreign equity. Also, it may be defined as the current account deficit.
From equation (2) the money supply and the associated domestic debt and foreign debt must grow faster than national income. The rate that it exceeds (nominal) national income is equal to the rate of inflation. That is:
(Yt/Y0)(Pt/P0) = (Lt/L0)/(Pt/P0) (4)
This can be written in terms of nominal income as:
Ynt/Yn0 = (Lt/L0)/(Pt/P0) (5)
Where Ynt is nominal income which is defined as:
Ynt = YtPt (6)
From equation (5) we can show that the rate of growth in the money supply is greater than the rate of growth of nominal income;
Lt/L0 = (Ynt/Yn0)(Pt/P0) (7)
This could be written as:
dLt = dYntdPt (8)
As the only source of money under the floating exchange rate system is from bank credit, it means that domestic debt is faster than nominal income by the rate of inflation. To understand this relationship, we could consider that debt servicing costs are also being inflated by the same rate of inflation applies to the productive side of the economy. There is corroborating evidence of this in Figure 1 below in which the Debt to GDP ratio grows at the same rate as inflation. That is:
(Pt/P0) = (Bdt/Bd0)/(Ynt/Yn0) (9)
As foreign debt grows with domestic debt, then it suggests that foreign debt is also growing faster than the economy's capacity to repay that debt.
Eventually, when domestic income can no longer service its debt, it causes a financial crisis and recession. (See the impact of the floating exchange rate on debt.) That is, there is a critical ratio of:
Bdt/Ynt
This is particularly evident on the USA webpage where the money supply and domestic debt is growing rapidly while economic growth and prices are rising at a relatively stable and slow rate. It may be possible to raise the critical ratio of debt to GDP by reducing interest rates and thereby reducing debt servicing costs. That appears to be the policy in the USA, UK and Europe. However, while that may allow the ratio of bank credit to GDP to rise a little further, it is only delaying the inevitable collapse of the financial system.
Australia and New Zealand were relatively slow adaptors of the floating exchange rate system. Their relative debt levels are not crippling, yet. But these economies are approaching their own crisis.
Figure 1, below is a chart showing the relative growth of bank credit, gross domestic product at current prices, prices and the ratio of bank credit (domestic debt) to GDP at current prices for Australia. It shows clearly how the bank credit is growing faster than gross domestic product at current prices. Since December 1984 (one year after the floating of the Australian dollar) the ratio of bank credit to GDP at current prices has increased 166 per cent. Hence the burden of domestic debt has more than doubled in that time.
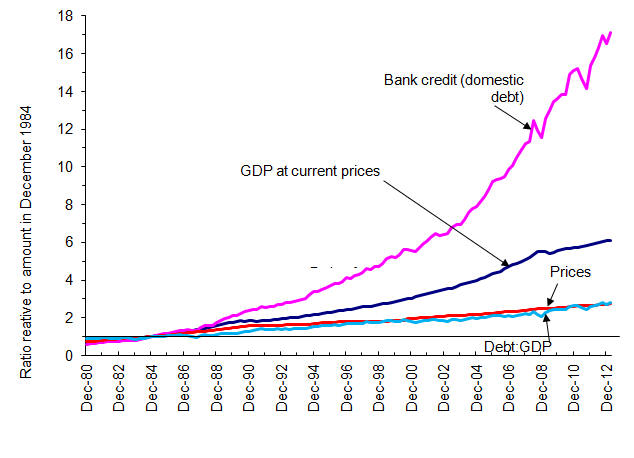
Figure 1: Australia: Unsustainable growth of debt
Figure 2 below is a similar chart for the USA showing the relative growth of bank credit, gross domestic product at current prices, prices and the ratio of bank credit (domestic debt) to GDP at current prices. For the USA, domestic debt does not appear to start becoming a problem until 1995. Before then, bank credit and GDP at current prices grow at together. Hence domestic debt from bank credit appears to have grown at a sustainable rate up until that time. After 1995, bank credit grows more rapidly than GDP at current prices. The ratio peaks in June 2009 at 49 per cent above the March 1995 ratio. However, since then, it has declined 13 per cent to 36 per cent in the June quarter 2011 before rising again to 49 per cent above in the December quarter 2015.
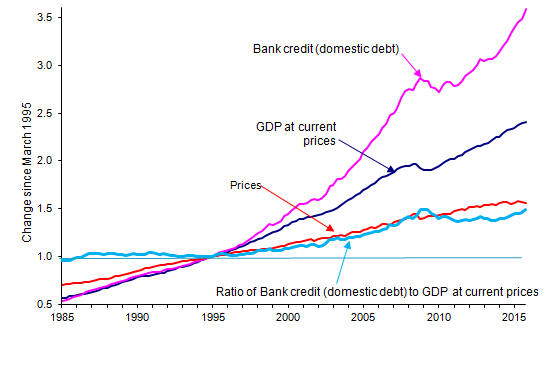
Figure 2: USA: Unsustainable growth of debt
The chart suggests that there was a major change in monetary policy in 1995 or 1996. It could have been that the USA may have applied floating exchange rate more strictly. This appears to be the case. The Federal Reserve, the Bundesbank and the Bank of Japan had regularly intervened in the foreign exchange market up until 1994. Since 1995, that intervention has declined particularly by the Federal Reserves and the Bundesbank (see Marcel Fratzscher Exchange Rate Policy Strategies and Foreign Exchange Interventions in the Group of Three Economies).
The Federal Reserve in the USA could ease its financial crisis by intervening in the foreign exchange market again. However, the only viable long term solution for countries such as the USA and Australia is to move to an exchange rate system such as the optimum exchange rate system or the guided exchange rate system. These combined monetary and exchange rate systems require reductions in net foreign debt to generate monetary growth. They also raise the rate of economic growth.
To read more about similar issues, look up the papers on the subject.
Growth of Debt and Loss of Income in America goes further, looking at the reasons for the change in monetary policy that brought about the growth of domestic and foreign debt and explains the general decline of manufacturing industries in the United States.
Home Issues Research Australia Philippines New Zealand USA
Last update: 30 March 2015